

Hone your POCUS interpretation and clinical reasoning by working through the interactive cases below.
Case #6: A straightforward GI bleed…or not?
This is the case of a 55-year old woman with a medical history significant for cirrhosis with portal hypertension, admitted with a GI bleed. She presented to an outside hospital with hematemesis and was hemodynamically unstable, so was initiated on a massive transfusion protocol, intubated for airway protection, and transferred to a tertiary care centre.
Initial endoscopy from GI revealed active bleeding from the GE junction, but there was too much blood in the stomach for definitive management. She is pending repeat endoscopy.
Post-EGD she was transferred to the ICU. She had ongoing hypotension and active hemorrhage; and at the time of the POCUS team assessment, was on norepinephrine at 28mcg/min and vasopressin 1.8u/hr, as well as pantoprazole and octreotide infusions. She was intubated on minimal ventilator settings. She was markedly tachycardic in the 130-150 range.
Here’s a clip from the initial cardiac POCUS:
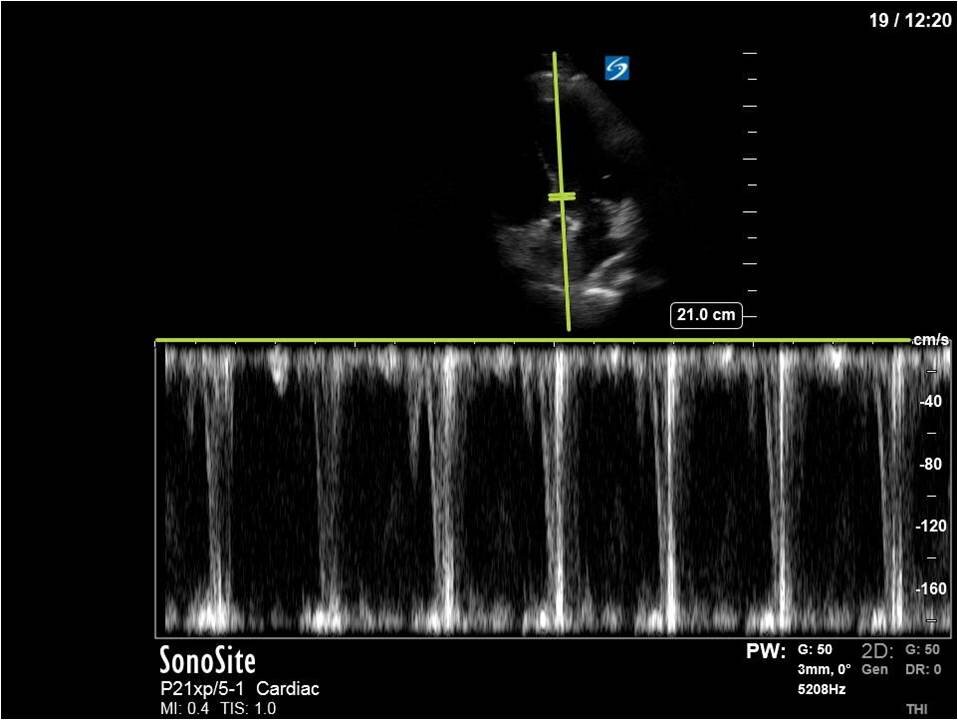
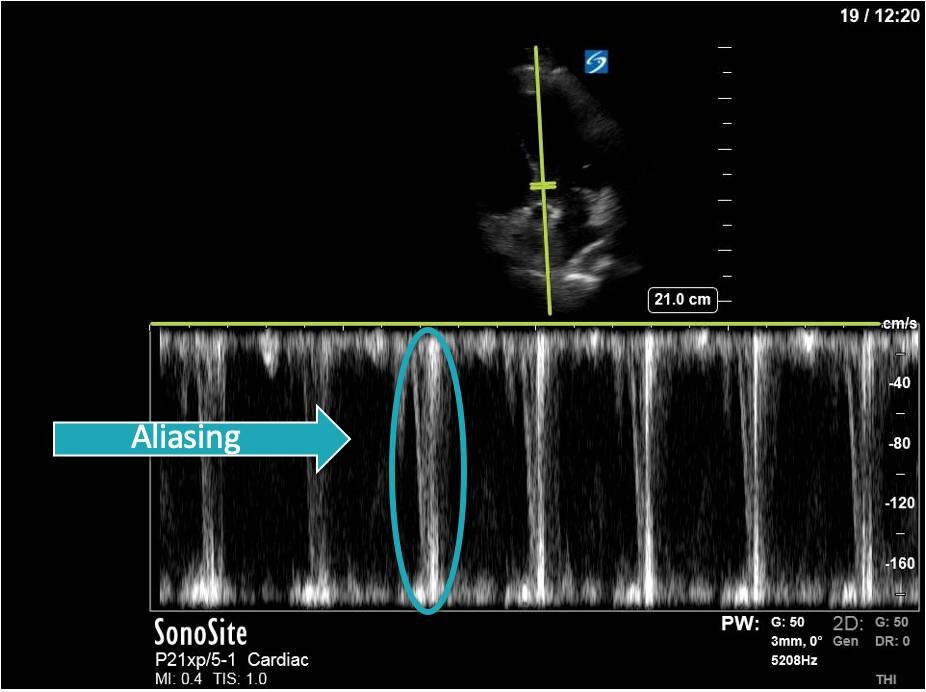
In this case, the tracing is imperfect as the A5C image was challenging and varied with respiration. Nevertheless, we can clearly see aliased signal that is unmeasurable with PW.
This is one of the general advantages of spectral doppler – in cases where the 2D images are not ideal and difficult to interpret, the spectral tracing is often more “forgiving” and you can still obtain valuable information.

Here we can see that measured VTI far exceeds the normal range of 18-22cm. More concerning and hemodynamically relevant, however, is the maximal pressure gradient generated by the LVOT obstruction: 62.5mmHg, which is certainly significant!
Also note the classic dagger-like shape of the VTI tracing: this is seen in cases of LV outflow tract obstruction, and is due to a rapid rise in pressure gradient to a high peak, followed by a fairly abrupt cessation of blood flow as the outflow tract becomes completely obstructed.
There are a few things that can cause LV outflow tract obstruction. A common cause is SAM – systolic anterior motion of the mitral valve. SAM is classically thought of as occurring in the setting of Hypertrophic Obstructive Cardiomyopathy (HOCM). However, there is increasing recognition that SAM can occur outside of HOCM, under certain physiologic conditions - typically hypovolemia, tachycardia, and increased inotropy; plus or minus underlying anatomic substrate (such as a sigmoid septum). These factors combine create to an empty, hyperdynamic ventricle that is susceptible to the Venturi effect - for more on this subject, see this screencast.
After noting the finding of LVOT obstruction with a significant gradient, the POCUS team went back to try to visualize the 2D finding of SAM in the PLAX view (the best TTE view to see it).
M-mode in the PLAX can sometimes also be helpful. What you’re looking for here is an additional peak of the M-mode tracing of the anterior mitral leaflet. In addition to the typical E and A waves, if SAM is present, you will see a third peak that occurs during ventricular systole.
In this case, the tracing was suboptimal and off-axis due to the challenging PLAX view, but we can still appreciate a third peak in the M-mode tracing.

When SAM is visualized in 2D, as is the case here, we can conclude that this is the location of the obstruction. Another useful tool to figure this out is to gradually walk your PW back into the LV cavity in an A5C view and note the location at which the velocity becomes measurable.
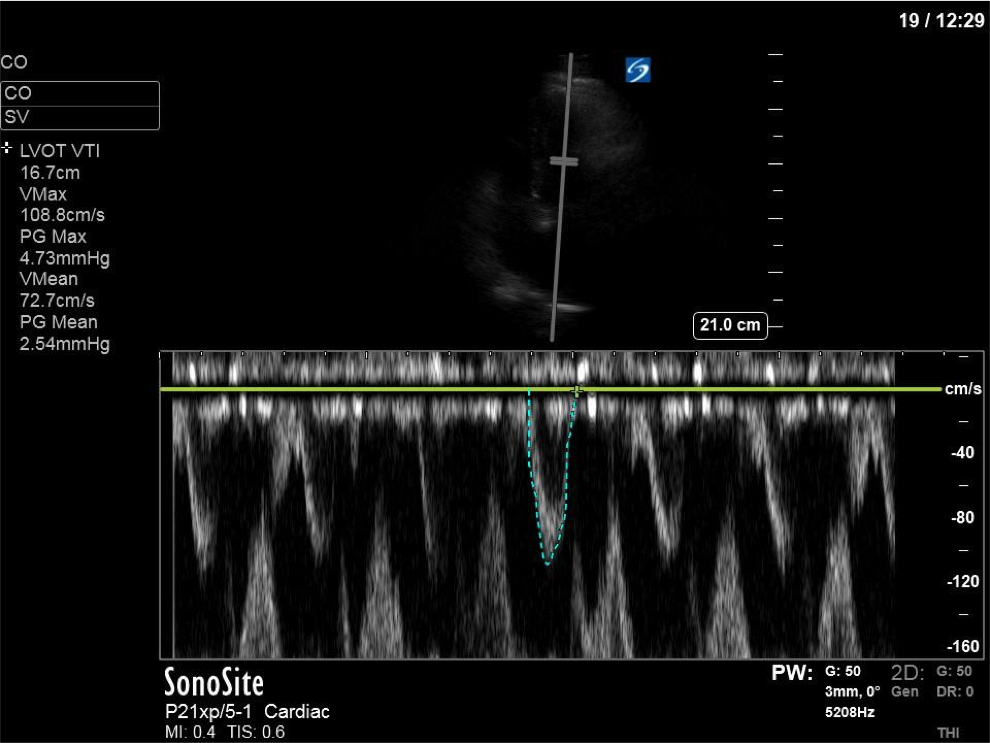
In this image (below), we can see that at a mid-cavity location, the velocity is not aliased and easily measured with PW; we know then that the obstruction and accelerated flow must be occurring distal to this.
(Note that due to the PW sample gate’s mid-cavitary location, we’re also partly capturing mitral inflow during diastole here – we can appreciate the E and A waves).
The patient received aggressive volume expansion (with blood products, due to her ongoing bleeding), which immediately substantially reduced her vasopressor requirements (norepinephrine was down to 4; vasopressin was off) and improved her tachycardia (HR now in the 90s). Given this dramatic improvement, the ICU team held off on the addition of beta-blockers. A repeat POCUS scan was done 12 hours later, which revealed the following:

As you can see, there is no longer aliasing in the LVOT PW tracing, and we can now measure cardiac output. In this case, VTI/cardiac output was high, consistent with corrected hypovolemia and and ongoing low-SVR state (cirrhosis). However, we no longer have an elevated pressure gradient.
PoCUS Pearls
1. All patients in shock deserve a POCUS with a cardiac output measurement, even if the cause of shock seems obvious
2. Aliasing in the PW tracing of the LVOT should prompt you to consider LVOT obstruction and SAM, and pursue additional clips to investigate this
3. Treatment of LVOT obstruction includes correction of hypovolemia, removal of inotropic agents, and beta-blockers